Struggling to create charts in Excel? Tired of wrestling with confusing templates, tweaking axes, or manually formatting data to get that perfect visual?
What if you could simply upload your spreadsheet and say:
Create a bar chart comparing quarterly sales by product.
…and have a polished, presentation-ready chart in seconds?
Enter Excelmatic, the AI-powered tool that makes charting as easy as a conversation. With just a few words, you can generate stunning bar, line, or **pie charts—no formulas, no design skills, and completely free.
Why Excelmatic Is a Game-Changer
Excelmatic is a free, cloud-based platform that transforms your Excel or CSV data into professional visuals using natural language. No more digging through Excel’s chart wizard or hunting for the right template online.
Here’s what Excelmatic offers:
- Bar Charts: Ideal for comparing categories like sales by region or product performance.
- Line Charts: Perfect for tracking trends, such as revenue over time or website traffic.
- Pie Charts: Great for visualizing proportions, like market share or budget allocation.
With Excelmatic, you describe what you want, and the AI handles the rest—formatting, labeling, and styling included.
Who Can Benefit from Excelmatic?
Excelmatic is designed for everyone, whether you’re:
- A small business owner creating sales reports.
- A marketer building dashboards for campaigns.
- A student preparing data visuals for a project.
- An analyst tired of repetitive chart-building tasks.
If you’ve ever searched for:
How to make Excel charts without formulasFree AI chart generator for spreadsheetsQuick Excel chart templates
…Excelmatic is your answer. It’s intuitive, fast, and requires zero technical expertise.
Real-World Chart Examples with Excelmatic
Let’s see Excelmatic in action with some practical examples.
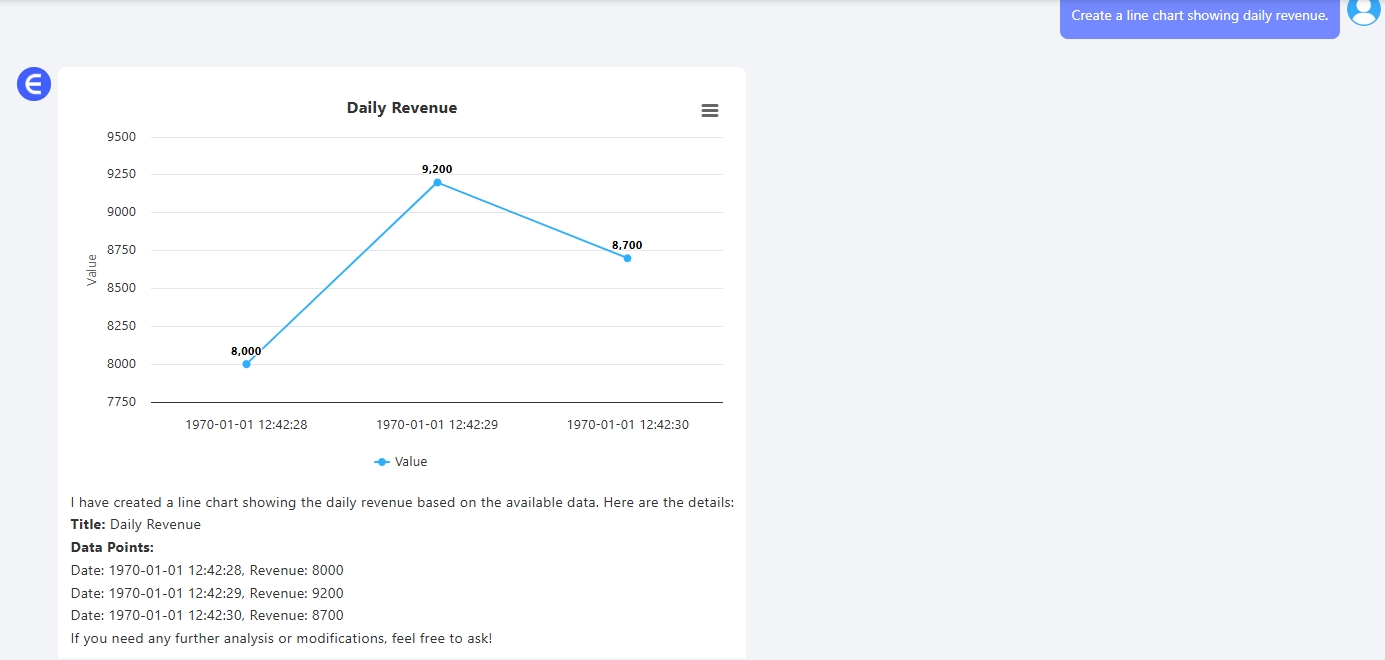
1. Line Chart – Tracking Revenue Trends
Sample Data:
| Date | Revenue ($) |
|---|---|
| 2025-04-01 | 8,000 |
| 2025-04-02 | 9,200 |
| 2025-04-03 | 8,700 |
| 2025-04-04 | 9,500 |
Prompt:
Create a line chart showing daily revenue for April 2025.
Result:
2. Bar Chart – Comparing Product Sales
Sample Data:
| Product Category | Sales ($) |
|---|---|
| Accessories | 12,000 |
| Electronics | 9,800 |
| Apparel | 4,500 |
Prompt:
Show a bar chart comparing sales across product categories.
Result:

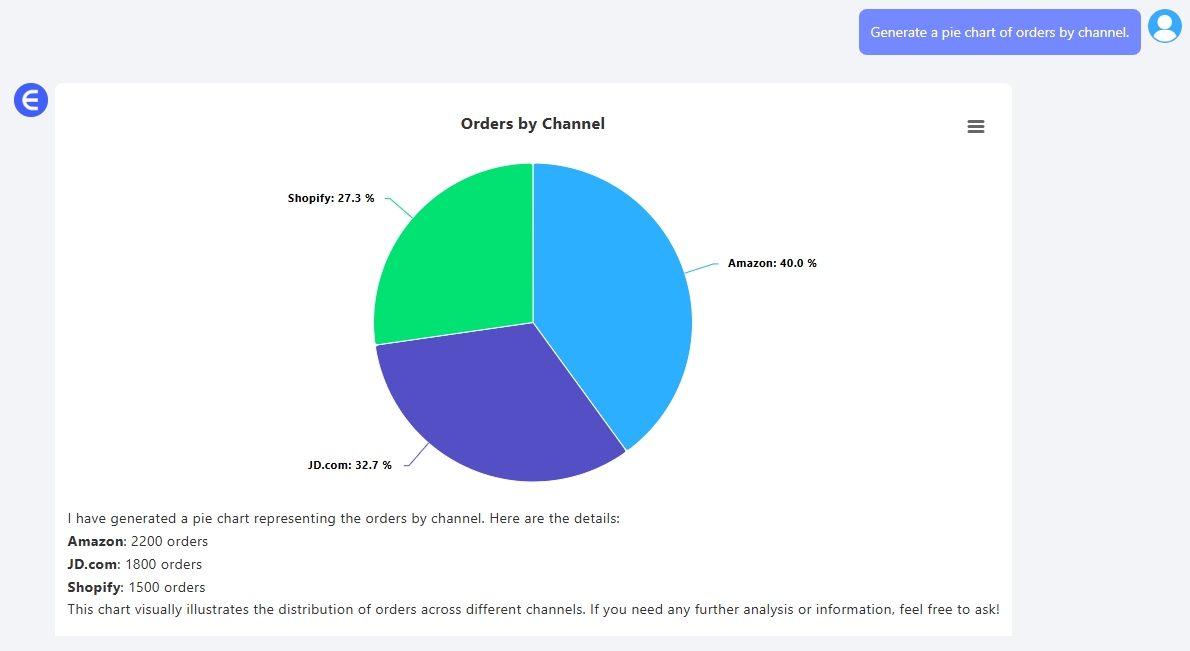
3. Pie Chart – Marketing Channel Breakdown
Sample Data:
| Channel | Orders |
|---|---|
| Amazon | 2,200 |
| JD.com | 1,800 |
| Shopify | 1,500 |
Prompt:
Generate a pie chart showing orders by marketing channel.
Result:
Excelmatic vs. Traditional Excel Charting
Why choose Excelmatic over manual Excel charting or downloadable templates? Here’s a quick comparison:
| Feature | Traditional Excel Charts | Excelmatic AI Tool |
|---|---|---|
| Ease of Use | Steep learning curve | Just type what you want |
| Time to Create | 10–30 minutes | Under 60 seconds |
| Design Skills Needed | Yes | None |
| Customization | Manual tweaks required | AI handles styling |
| Cost | Templates may cost | 100% free |
| Export Options | Limited flexibility | PNG downloads, no watermark |
Excelmatic saves you time and effort while delivering professional results every time.
Bonus Features of Excelmatic
Beyond the basics, Excelmatic offers:
- Smart Suggestions: Not sure which chart type to use? The AI recommends the best fit for your data.
- Multi-Chart Support: Generate multiple charts from one dataset with different prompts.
- Cross-Platform Access: Works on desktop, tablet, or phone—no software installation needed.
- Custom Styling: Want a specific color scheme or font? Just ask, and the AI adjusts.
These features make Excelmatic a versatile tool for both beginners and seasoned data pros.
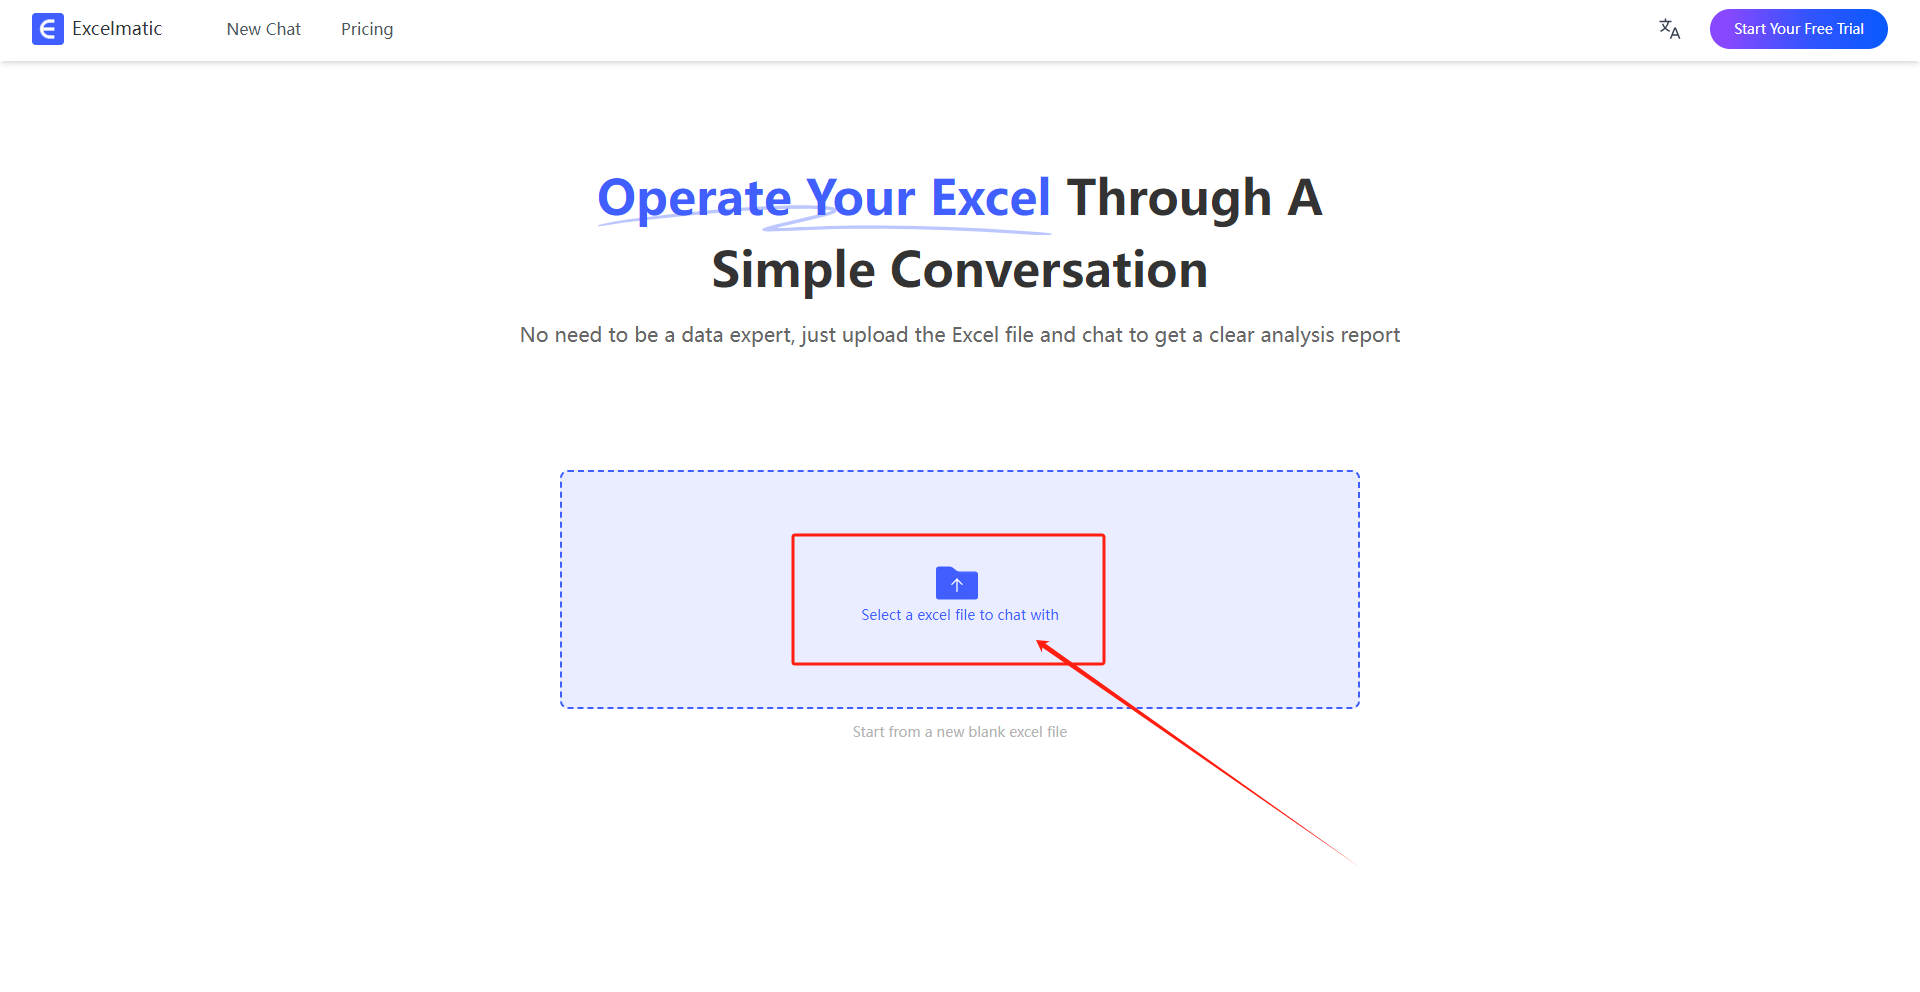
How to Create and Download Your Chart
Getting started with Excelmatic is as easy as 1-2-3:
- Upload Your Data: Drag and drop your Excel or CSV file at Excelmatic.
- Type Your Prompt: Example:
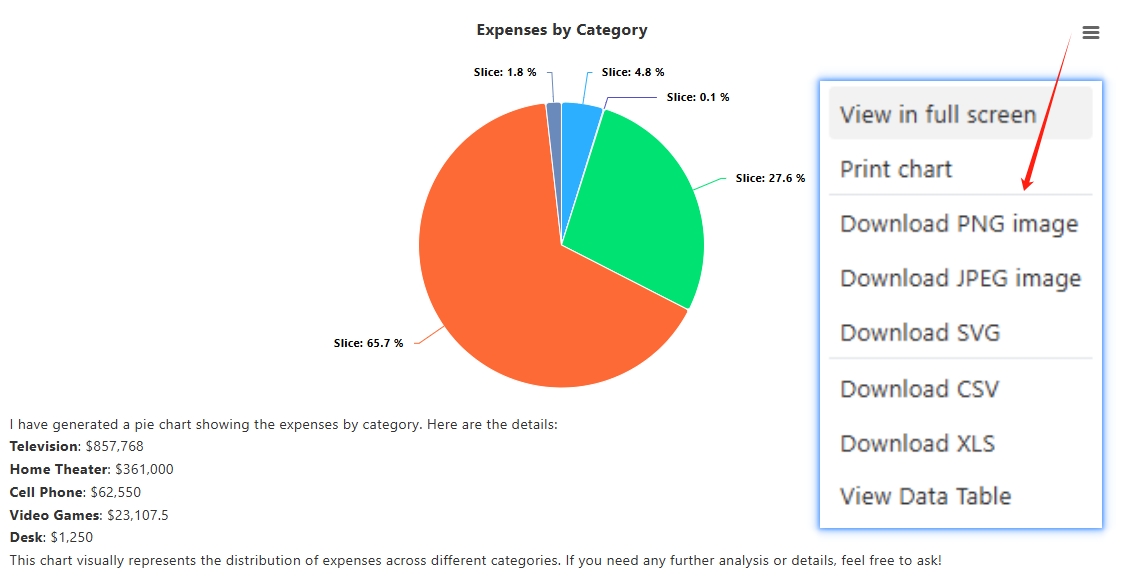
Show a pie chart of expenses by category.
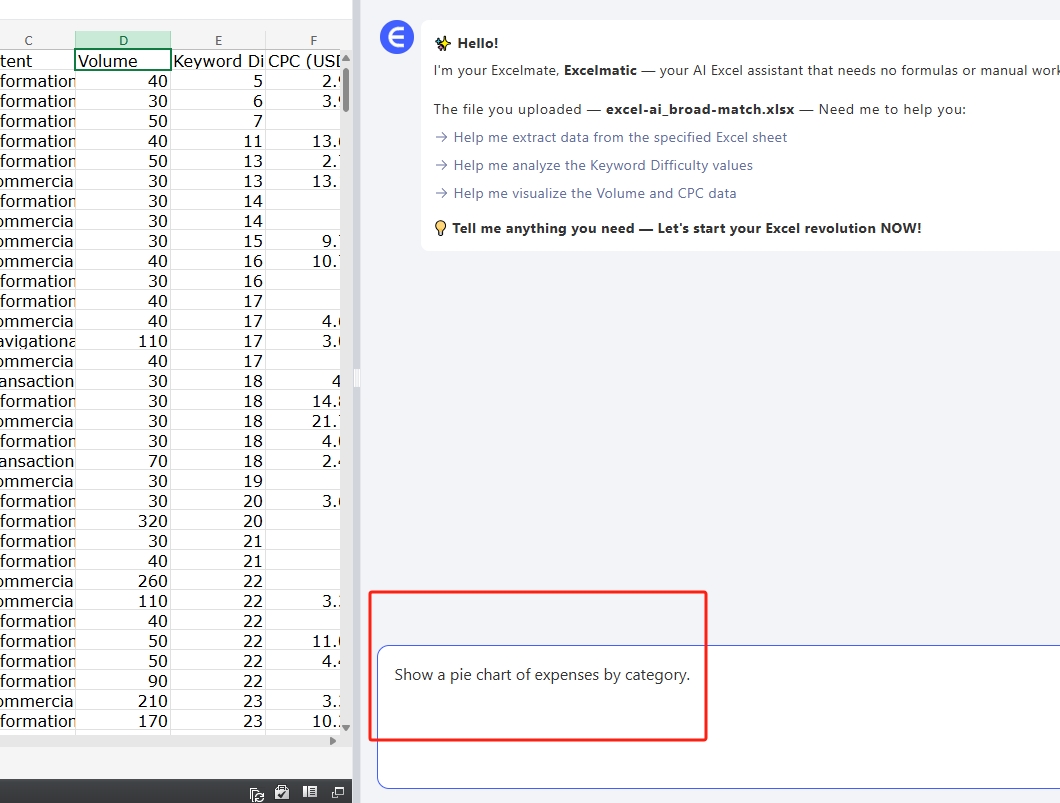
- Download Instantly: Get a high-quality PNG chart (no watermarks) for reports, slides, or social media.
No sign-up required, no hidden fees—just pure charting magic.
Pro Tips for Using Excelmatic
- Be Specific: Prompts like
Bar chart of sales by month, sorted high to lowyield precise results. - Clean Your Data: Ensure your spreadsheet has clear headers to help the AI understand your columns.
- Experiment Freely: Try different chart types or prompts to find the perfect visual for your story.
- Combine Charts: Use multiple charts in one report for deeper insights (e.g., a pie chart for proportions + a line chart for trends).
Why Excelmatic Is Your Go-To Charting Tool
Excelmatic isn’t just about saving time—it’s about empowering anyone to tell compelling data stories. Whether you’re:
- Building weekly KPI dashboards for your team.
- Visualizing marketing ROI for stakeholders.
- Creating social media content to engage your audience.
Excelmatic delivers polished, professional charts that make your data shine.
Ready to try it? Create your first chart now at Excelmatic and see how easy data visualization can be.