In today’s data-driven world, we’re surrounded by information from every direction. The ability to quickly extract, structure, analyze, and visualize that data is becoming a critical productivity skill.
But the challenge is:
- Data is often buried in paragraphs, chats, or voice notes;
- Manually organizing it takes time and effort;
- Creating charts means clicking endlessly through menus, formatting, and color matching…
What if one workflow could handle data extraction + structuring + charting, all in one go?
It can — and all you need are two AI tools:
ChatGPT: Converts messy, unstructured language into clean, structured tables
Excelmatic: Analyzes your table and generates insightful, beautiful charts — instantly
Why ChatGPT + Excelmatic Instead of Other Tools?
| Scenario | Traditional Method | AI Workflow |
|---|---|---|
| Organizing customer feedback | Manual sorting & copy-paste | ChatGPT extracts and formats Excel tables |
| Visualizing sales data | Excel formulas + manual chart creation | Excelmatic auto-detects fields & visualizes instantly |
| Report building | Analyze → chart → write | ChatGPT + Excelmatic deliver structure + visuals |
This isn’t just about tools — it’s about a complete, closed-loop productivity system that flows from raw content to final insights.
Step 1: ChatGPT Turns Unstructured Text into a Table
Let’s start with a real-world example.
Original text:
On April 1, salesperson Li visited client Zhang San, who was interested in the X300 projector, priced at ¥4800. On April 3, Wang called Li Si about the Y100 speaker. The client asked to decide later. On April 5, the sales manager summarized the progress: Zhang confirmed the purchase, Li Si postponed. Wang Wu showed interest in the Z900 headphones (¥999), but no update yet.
Prompt Example:
Please structure the following sales updates into an Excel table with columns: Date, Salesperson, Client, Product, Quote, Client Status.
ChatGPT Output:
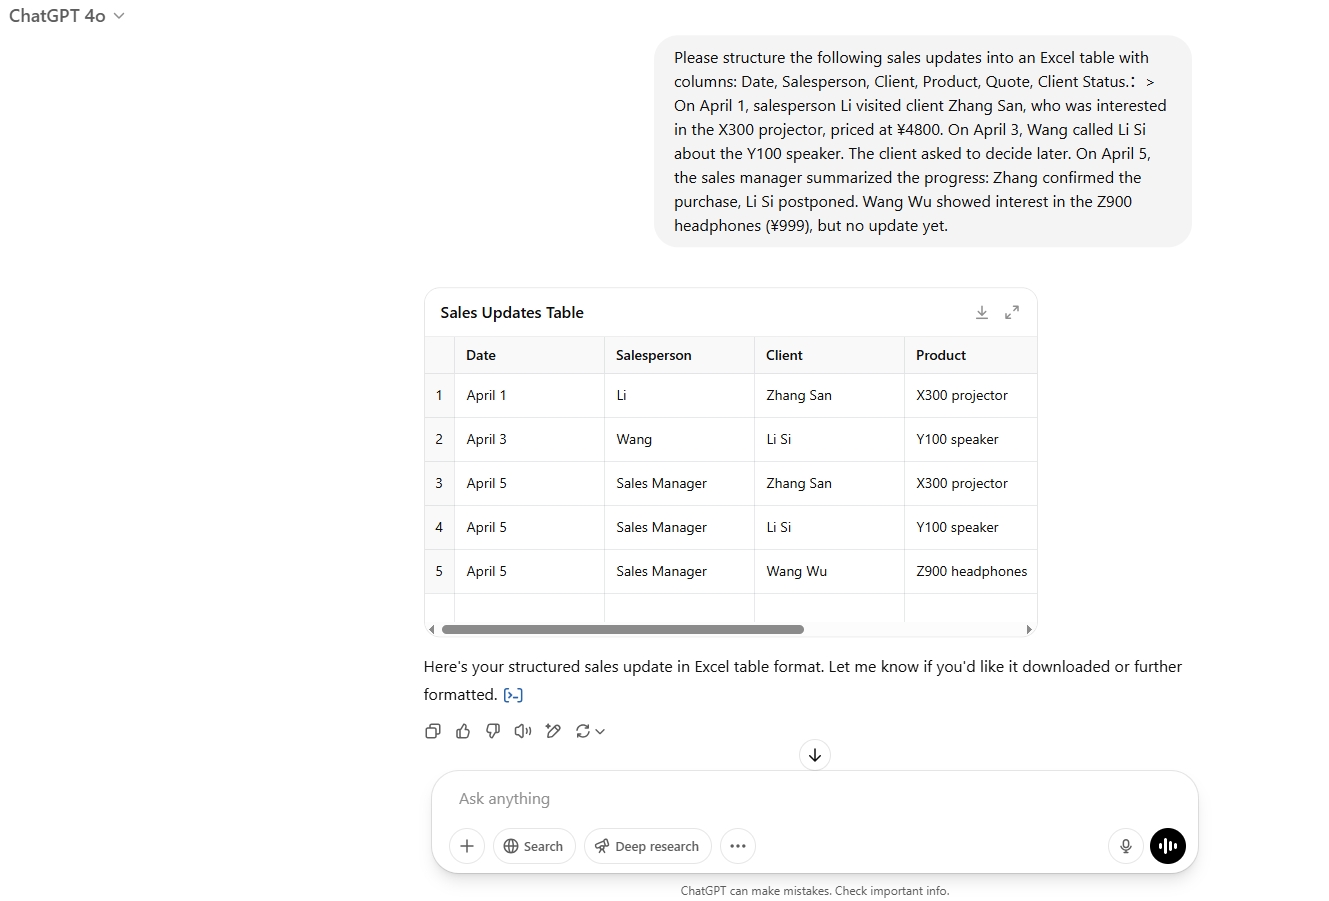
A messy block of text becomes a clean, structured table — ready for Excel or CSV export and further analysis with Excelmatic.
Step 2: Excelmatic Transforms Tables into Charts
Once you upload your structured table to Excelmatic, there's no need to define axes, pick chart types, or tweak labels manually.
Excelmatic’s AI engine detects your structure and recommends the most suitable visual.
Example Prompts You Can Use:
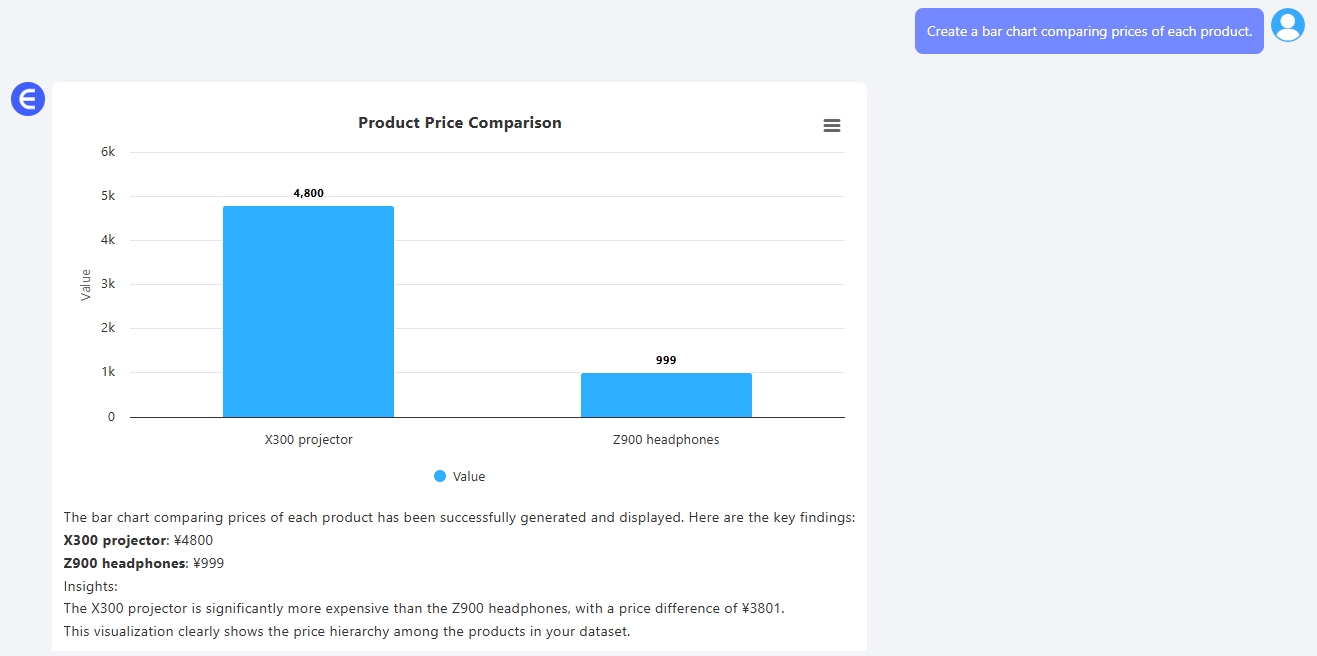
Price Comparison by Product
Prompt:
Create a bar chart comparing prices of each product.
Output:
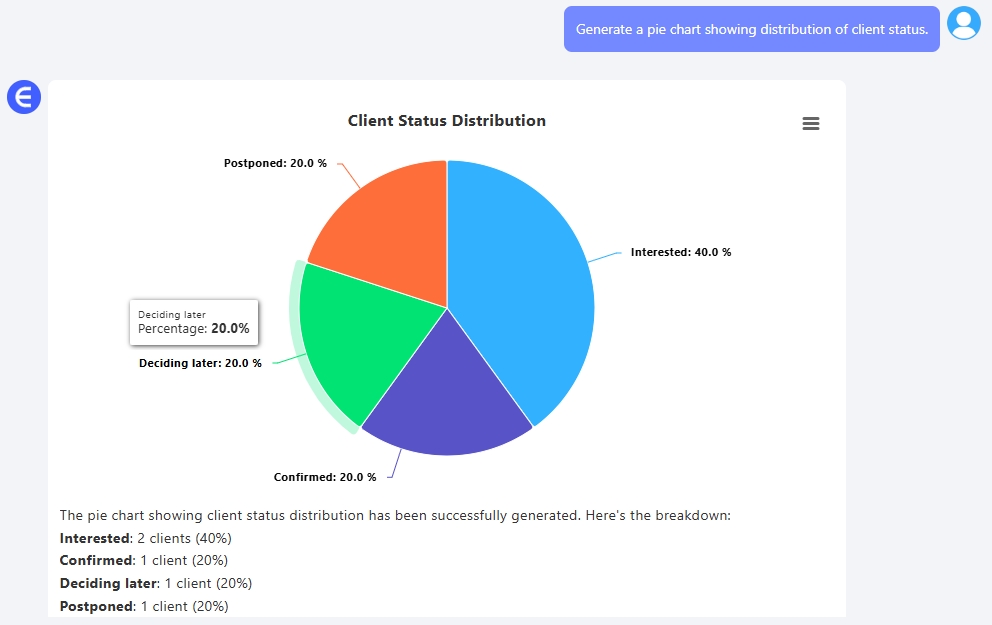
Client Status Distribution
Prompt:
Generate a pie chart showing distribution of client status.
Output:
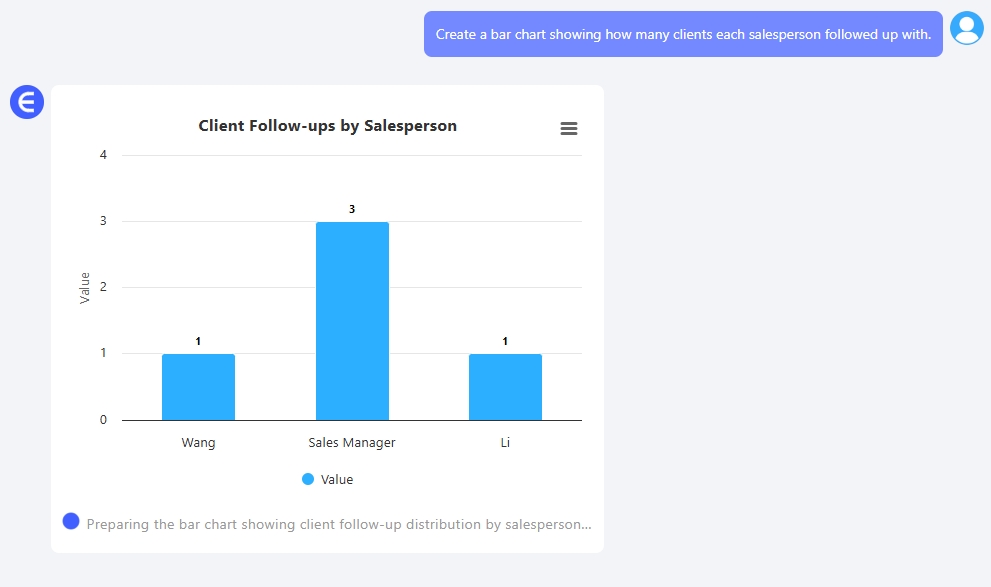
Salesperson Activity Overview
Prompt:
Create a bar chart showing how many clients each salesperson followed up with.
Output:
Plus: Excelmatic Saves Your 20 Most Recent Chart Sessions
- Every chart prompt and its output is automatically saved
- You can reopen Excelmatic and continue from where you left off
- Quick access to history avoids repetitive uploads
Tip: Perfect for multi-round editing, trying different chart types, or reworking chart colors and layout without losing context.
Power Tips for ChatGPT + Excelmatic Users
ChatGPT Prompt Templates:
| Goal | Prompt |
|---|---|
| Product list structuring | “Extract product name, category, and price into a table” |
| Meeting summary | “List all tasks, owners, and due dates from the following meeting notes” |
| Feedback analysis | “Classify customer feedback by issue type and summarize in table form” |
Excelmatic Chart Prompts:
| Use Case | Prompt |
|---|---|
| Trend line | “Line chart showing weekly number of new clients” |
| Sales performance | “Bar chart comparing revenue by salesperson” |
| Share breakdown | “Pie chart showing sales by product category” |
FAQs
Q: What if ChatGPT gives inconsistent table structure?
Tip: Define your columns clearly in the prompt (e.g. Date, Client, Product, Status).
Q: Excelmatic can’t recognize my table — what now?
Ensure your first row has column names, and that formatting is consistent. Or use ChatGPT to reformat.
Q: Does Excelmatic store my uploaded data?
No. Files are only processed during your session. Only your 20 most recent chart instructions are stored for convenience. You can clear them anytime.
Q: Do I need an account to use Excelmatic?
Yes, login is required — but a free trial is available after signing up. You can experience key features without paying upfront.
Final Thoughts: A Seamless AI Workflow from Raw Text to Beautiful Charts
You no longer need to:
- Copy-paste for hours;
- Fight with Excel formatting;
- Struggle to figure out which chart to use.
With these two tools:
- ChatGPT handles extraction, structure, and formatting
- Excelmatic handles visualization, analysis, and chart generation
Even if you don’t know formulas or design, you’ll look like a data pro.