In the data-driven era, Excel templates have become workplace crutches. You've probably downloaded sales daily reports, inventory templates, ad analytics dashboards... But have you noticed?
More templates ≠ More efficiency
- Alter one field, formulas collapse
- Larger datasets cause lagging
- "Which ad group had the highest ROI?" → Manual column adding ensues
Templates create dependency, not solutions.
This guide reveals an upgraded workflow requiring:
- ChatGPT-generated structured data
- Excel file preparation
- Excelmatic upload
- Natural language queries for instant insights
Part 1: The Hidden Costs of Popular Excel Templates
Scenario 1: E-commerce Daily Sales Report
Users: Amazon sellers, operations staff
Fields: Date/SKU/Product/Quantity/Unit Price/Sales/Cost/Profit/Margin/Channel
Pain Points:
- Daily copy-paste drudgery
- Formula breakdowns with SKU variations
- No dynamic channel comparison
Scenario 2: Advertising ROI Template
Users: Digital marketers, analysts
Fields: Campaign/Impressions/Clicks/Conversions/Spend/Sales/ROI/ACOS/CPC
Challenges:
- Manual CSV merging
- Static charts with limited dimensions
- No category/channel drill-down
Scenario 3: Executive Monthly Summary
Users: Executives, analysts
Fields: Total Sales/Orders/New Customers/Return Rate/Ad Spend/ROI/MoM Growth/YoY Change
Critical Issues:
- Multi-source data consolidation
- Outdated visualizations
- No root-cause analysis capabilities
Scenario 4: Inventory Alert System
Users: Supply chain managers
Fields: SKU/Current Stock/Safety Stock/7-Day Sales/Reorder Advice/Alert Status
Operational Friction:
- Error-prone manual formula replication
- No stock-out ETA calculations
- ERP data field mismatches
Part 2: Why Your Questions Outgrow Templates
Traditional templates only answer predefined questions, while real-world challenges demand dynamic analysis:
Which high-margin SKUs have low turnover?Which campaigns have low ACOS but high CVR?"What's driving regional complaint spikes?
This is where ChatGPT + Excelmatic revolutionizes workflows
Part 3: AI-Powered Analysis Workflow (No Formulas Required)
Step 1: Generate Structured Data with ChatGPT
Input raw data,Convert this into Excel table with columns: Product, Sales, Date
Step 2: Prepare Excel File
Paste ChatGPT's output into Excel. Save as .xlsx/.csv.
Step 3: Upload to [Excelmatic](https://excelmatic.ai)
Ask natural language questions:
Show monthly sales by product as bar chart
List campaigns with ROI<1, sorted descending
Which channel has rising return rates?
Excelmatic will:
- Clean and interpret your data
- Generate the analysis or chart you requested
- Provide a human-readable summary and insights
- Let you continue asking follow-up questions
All without building a single formula or pivot table.
Part 4. Excel Templates vs. Excel AI: A Comparison
| Feature | Excel Templates | ChatGPT + Excelmatic |
|---|---|---|
| Data Format Sensitivity | Very high | Tolerant, flexible |
| Learning Curve | Medium-high (formulas, pivots) | Low (plain English) |
| Reusability | Fixed structure | Dynamic, per question |
| Analysis Scope | Limited | Open-ended |
| Output | Static reports | Interactive, summarized |
| Customization | Manual and fragile | On-demand |
| Speed | Slow updates | Real-time insights |
Part 5. Who Should Use This?
If any of these sound like you, you’ll benefit immediately:
- You spend hours updating the same reports every week
- You struggle with Excel formulas or pivot tables
- Your data comes from messy, non-standard sources
- You want to explore data insights beyond the basic template
Part 6. What You Need to Get Started
| Tool | Purpose | Free to use? |
|---|---|---|
| ChatGPT | Formatting, formulas, data structuring | Yes (Free version is enough) |
| Excel or Google Sheets | Paste and save data as .xlsx |
Yes |
| Excelmatic | Analyze Excel files using natural language | Yes (Free trial available) |
Part 7. Real Example: End-to-End Workflow
Here’s how the full process might look in real life:
Copy messy product sales data from a WhatsApp message
Ask ChatGPT:
Turn this into a structured Excel table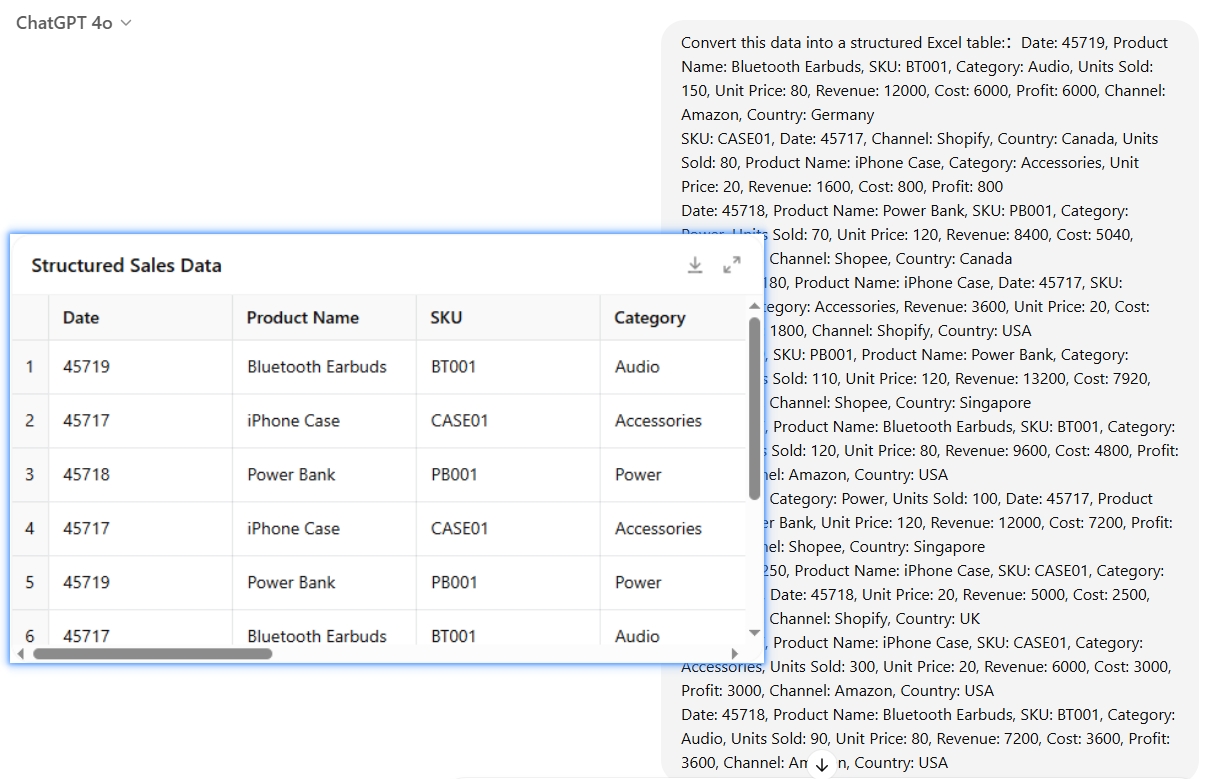
Paste the result into Excel and save as
sales_report.xlsx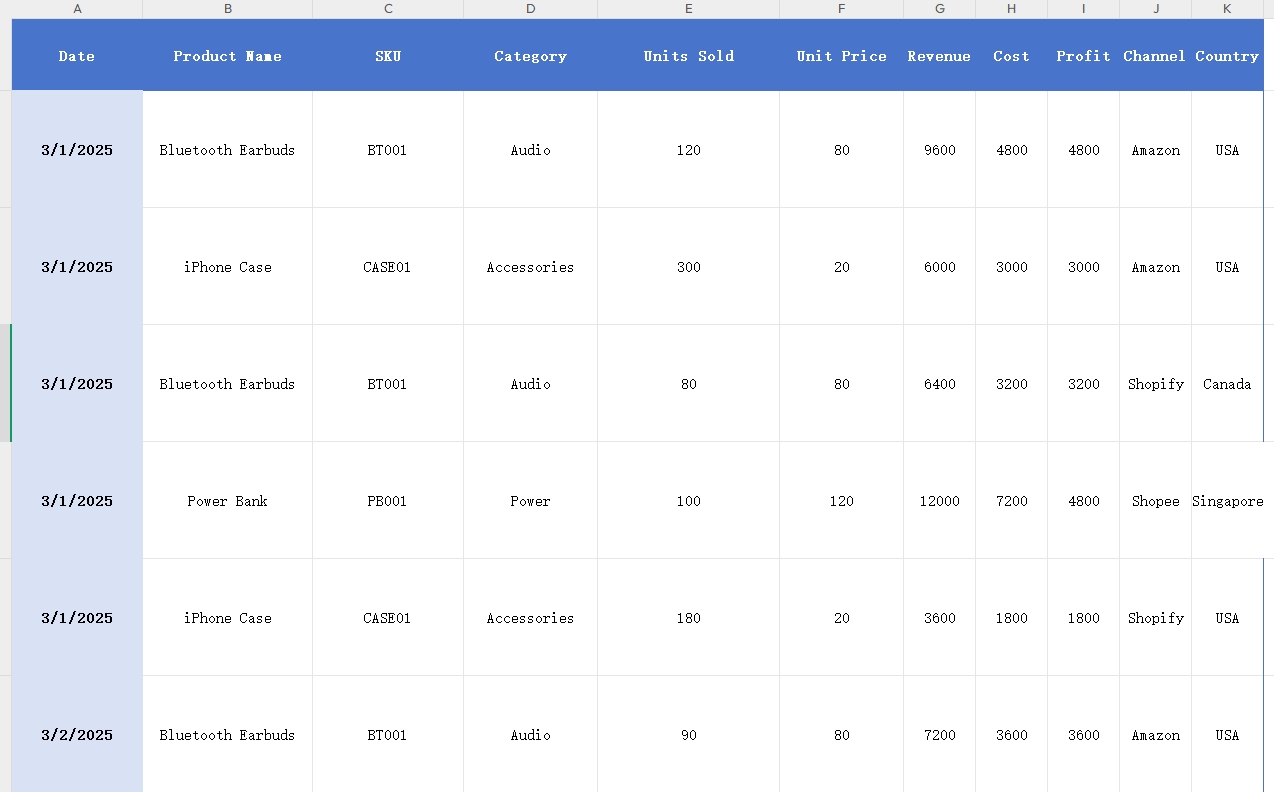
Upload to Excelmatic
Ask:
Which product had the highest revenue in March? Generate a bar chart and write a summary.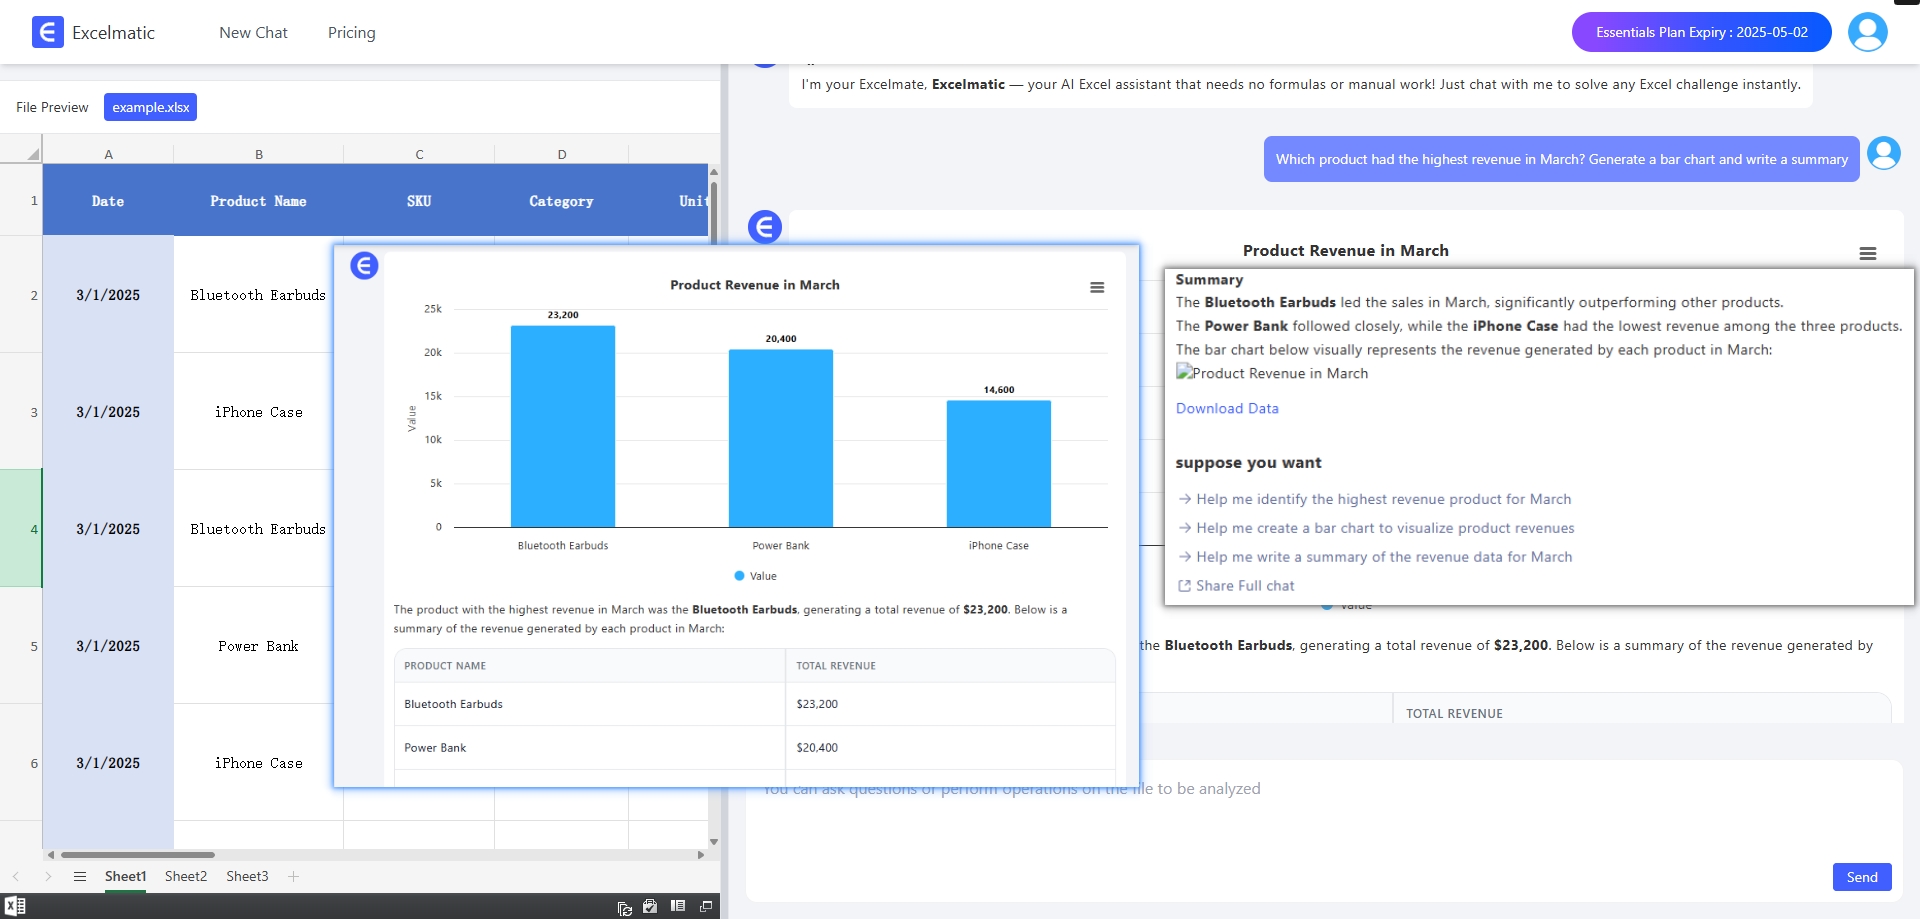
Done — no formulas, no templates, no guesswork
Part 8. From Template Filler to Data Analyst
Templates taught you how to follow instructions.
AI teaches you how to ask better questions.
This is a career shift in how you use Excel:
From clicking around aimlessly → to leading with data-powered decisions.
AI doesn’t replace you. It upgrades you.
Final Thoughts
You no longer need to spend hours searching for templates.
You don’t have to debug broken formulas.
You don’t need to write a single line of code.
You only need to know what you want to ask.