Ever found yourself wrestling with Excel charts and asking:
- What chart type should I use?
- Why does my chart look so boring?
- Why does formatting take longer than creating the data?
If you’re tired of manual adjustments and want faster, cleaner, and smarter data visualization, AI-powered Excel chart editors might be just what you need.
Today, we’re diving into Excelmatic, a lightweight yet powerful AI Excel chart editor designed specifically for users who want quick, beautiful charts — without needing to be an Excel power user. But how does it stack up against tools like Microsoft Copilot?
Why Use AI for Excel Charts?
Let’s face it — traditional Excel charting can be tedious:
- Manually selecting data, choosing the right chart type, tweaking axis labels and legends...
- Trial and error with chart formats that still don’t look right
- Losing valuable time, especially during tight deadlines
AI chart editors solve this by:
- Recommending the best chart type for your data
- Automatically formatting your charts to look professional
- Saving you time and energy, especially if you’re not a chart expert
What Is Excelmatic?
Excelmatic is a dedicated AI Excel chart editor that lets you upload Excel or CSV files and get instant chart suggestions based on your data — no coding, no formulas, no manual formatting.
You simply describe the chart you want, like:
“Create a bar chart showing quarterly revenue.”
And Excelmatic does the rest — it understands your structure, picks the right axes, selects a suitable chart type, and outputs a polished visual in seconds.
Chart Types Supported (as of April 2024)
- Bar Chart
- Line Chart
- Pie Chart
✅ Scatter plots, stacked charts, area charts, and time series visualizations are currently in development — stay tuned!
The system analyzes your dataset and recommends the most suitable visual layout — especially helpful if you’re unsure what chart type works best.
Who Is Excelmatic For?
| Use Case | How Excelmatic Helps |
|---|---|
| Students & Researchers | Quickly turn survey or experiment data into visuals |
| Sales & Marketing Teams | Visualize KPIs or quarterly metrics for reports |
| Data Analysts | Save time building initial visuals for presentations |
| Content Creators | Add clean, professional charts to blogs and newsletters |
Whether you’re prepping a pitch deck or building an annual report, Excelmatic helps you turn raw numbers into insight.
Real-World Example
Say you upload this table:
| Quarter | Sales |
|---|---|
| Q1 | 12000 |
| Q2 | 18000 |
| Q3 | 15000 |
| Q4 | 20000 |
Then type:
Create a bar chart comparing sales by quarter.
Excelmatic will automatically:
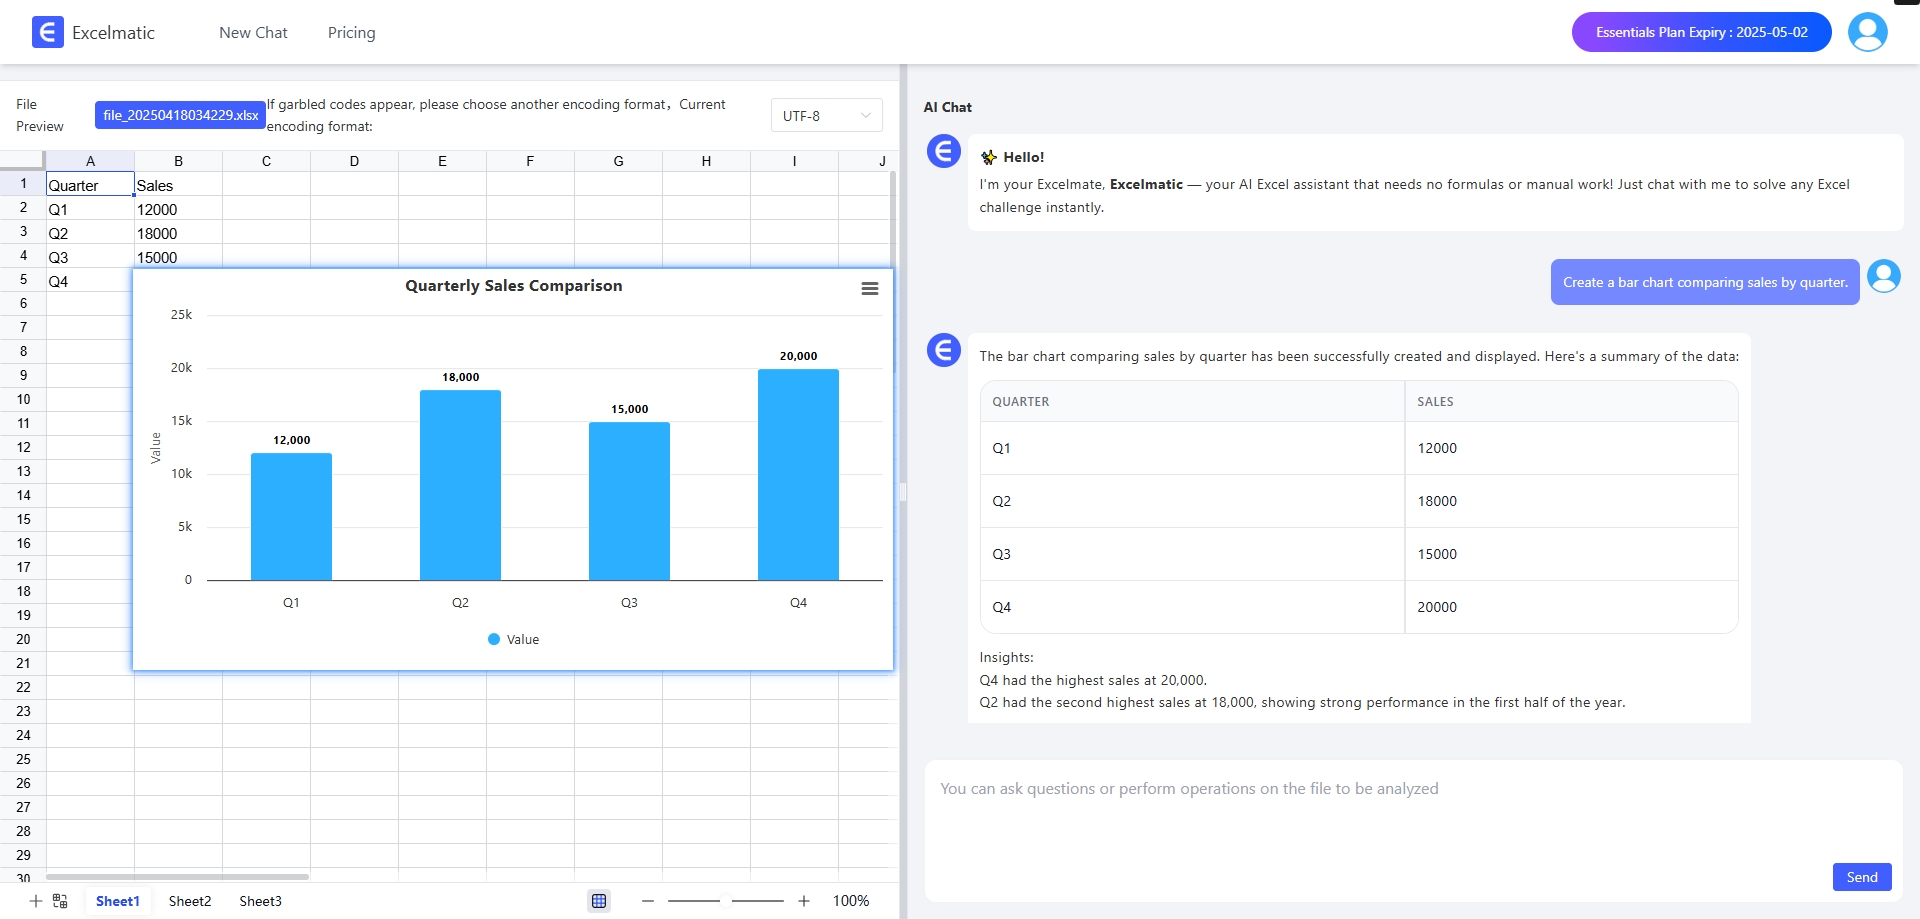
- Identify your X and Y axes
- Recommend a bar chart
- Apply styling (colors, labels, spacing)
- Allow you to export it in PNG or SVG format
All within seconds — no Excel formulas or chart wizard required.
Prompt Writing Tips: Talk to AI Like a Pro
Mastering natural language prompts can make your charts even more accurate.
| Goal | Example Prompt | What It Does |
|---|---|---|
| Basic Chart | Create a bar chart for monthly revenue |
Quick setup |
| Specify Type | Generate a line chart showing user growth from Jan to Jun |
Forces line chart |
| Add Comparison | Compare 2022 and 2023 sales using grouped bars |
Creates grouped bars |
| Highlight Trend | Show a trend line for product sales over time |
Adds trend overlay |
| Define Axes | Use "Region" as X-axis and "Profit" as Y-axis |
Custom control |
👉 Use verbs like create, generate, plot, or show for best results.
Copilot vs Excelmatic: What’s the Difference?
| Feature | Copilot | Excelmatic |
|---|---|---|
| Availability | Requires Microsoft 365 subscription | Free to use, no login required |
| Language Support | Optimized for English prompts | Optimized for English prompts |
| Focus | General Excel assistant | Chart-focused experience |
| Formatting | Manual adjustments often needed | Automatic styling |
| Output | Stays in Excel | Export to image or web formats |
If your goal is simply to generate clean, clear, and shareable charts — Excelmatic is purpose-built to do just that.
FAQ
Is Excelmatic free to use?
Yes! The basic version is free with no signup required.
Do I need to install anything?
Nope. It’s 100% web-based — just upload and go.
Is my data secure?
Absolutely. Excelmatic does not store your data and processes it securely during your session.
Does it support languages other than English?
Currently optimized for English prompts. Data in any language is accepted, but prompts work best in English.
Final Thoughts: Is Excelmatic Right for You?
If you regularly work with Excel data but:
- Don’t want to spend time tweaking chart formatting
- Struggle to pick the right chart for your dataset
- Need quick visuals for presentations or reports
Then Excelmatic is a powerful, free, and accessible alternative to Copilot and other tools. While Copilot shines as a general productivity assistant, Excelmatic goes deep on one thing: making your charts look great — fast.